(Bloomberg) -- A clutch of chart patterns suggests equities from China and Hong Kong are barreling toward more losses.

Slowing economic growth, mobility curbs to fight Covid, a deepening property crisis and regulatory spats are weighing on the outlook, while pledges of stimulus have failed to deliver a sustained market rebound. Sentiment took another hit on Monday after data showed a surprise contraction in China’s factory activity.

China’s CSI 300 Index, Hong Kong’s Hang Seng gauge and the Nasdaq Golden Dragon China index are already nursing declines of 7%, 10% and 13% from recent peaks in June and early July.

READ: Gloom Returns to China Stocks With Worst Monthly Loss in a Year

The charts below sum up underlying risks for the three equity gauges.
Hong Kong Fizzles
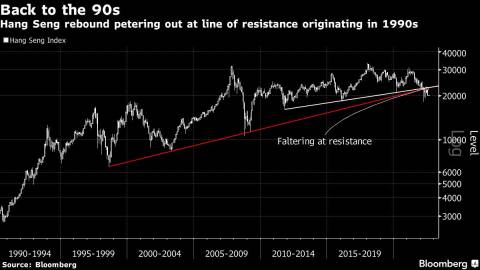
The Hang Seng bounced more than 22% from a March low to an April peak. Much of those gains dissipated as the index failed to vault a line of resistance originating from the 1990s. For some technical analysts, that means the gauge is vulnerable to a retest of the March nadir.
Losing Luster
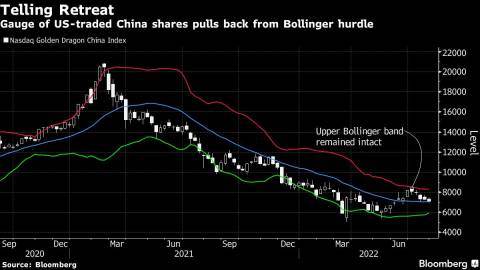
The 72-member Nasdaq Golden Dragon China gauge of US-traded Chinese shares failed at key resistance, the upper Bollinger band. The Bollinger study is a a popular way of analyzing volatility. The brief rebound in the index from May through June now looks increasingly like a bear-market bounce.
Mainland’s Travails
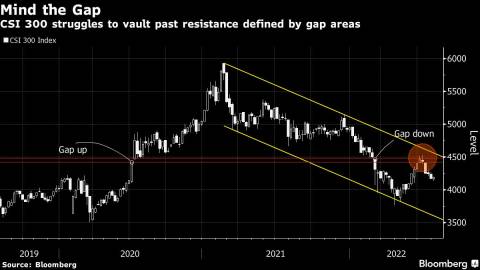
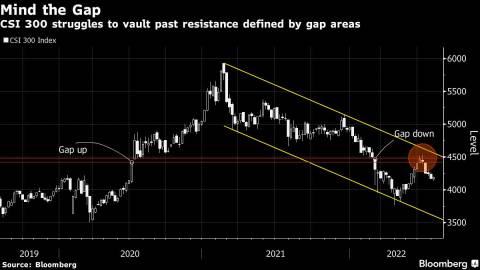
A gap up in the CSI 300 in 2020 and a gap lower in 2022 define an area of resistance for the gauge. Gaps refer to sharp moves in an asset’s price straddling periods of little or no trading activity. The CSI 300 failed to clear the resistance, and a downward channel from the 2021 highs remains intact.
More stories like this are available on bloomberg.com
©2022 Bloomberg L.P.
Author: Akshay Chinchalkar
